The NAAIM Exposure Index: Contrarian or Continuation Indicator?
In a previous blog post, I described the NAAIM Exposure Index, which represents the average exposure to U.S. equity markets as reported by members of the National Association of Active Investment Managers (NAAIM) in a weekly survey.
At the end of August 2026, the NAAIM Exposure Index hits a value of 102.66, meaning that U.S. active investment managers were in aggregate leveraged long in terms of U.S. stocks exposure.
This led to some interesting discussions on X about whether the NAAIM Exposure Index should be used as a contrarian indicator or as a continuation indicator.
In this third post of this series on sentiment indicators, I will show that the contrarian nature of the NAAIM Exposure Index is actually debatable, with high (resp. low) readings not bearish (resp. not bullish) over the medium term.
As an example of usage, I will show how to convert the values of the NAAIM Exposure Index into probabilities of drawdown for the U.S. stock market over the medium term.
Reminders on the NAAIM Exposure Index
The NAAIM Exposure Index is described elsewhere on this blog.
The NAAIM Exposure Index, a contrarian indicator?
The NAAIM Exposure Index, like most sentiment indicators, is typically considered as a contrarian indicator.
In other words, bullish sentiment numbers are often telling us that it is time to sell, not buy as you might think1.
There are various explanations for this phenomenon, some known to be false1 - for example the fact that the people polled are always wrong1 - and some probably closer to the truth like the explanation provided by Hepburn1:
When you think about this, you will realize that those who have invested their money are no longer potential buyers but have now become potential sellers. When the number of potential sellers is greater than the number of potential buyers, a condition is created from which markets move lower. At a point, all that is needed for the market to decline is some of that daily news that can drive prices down for no apparent reason.
It also works the other way, when everyone is bearish on the market. This indicates a shortage of potential sellers because everyone has already sold, and there is lots of cash on the sidelines. This often acts like rocket fuel for stock prices when a market turns around and buyers invest their cash.
It is then no surprise that the extreme reading of 102.66 on 26th August 2026 triggered some discussions on X, like the one captured in Figure 1.
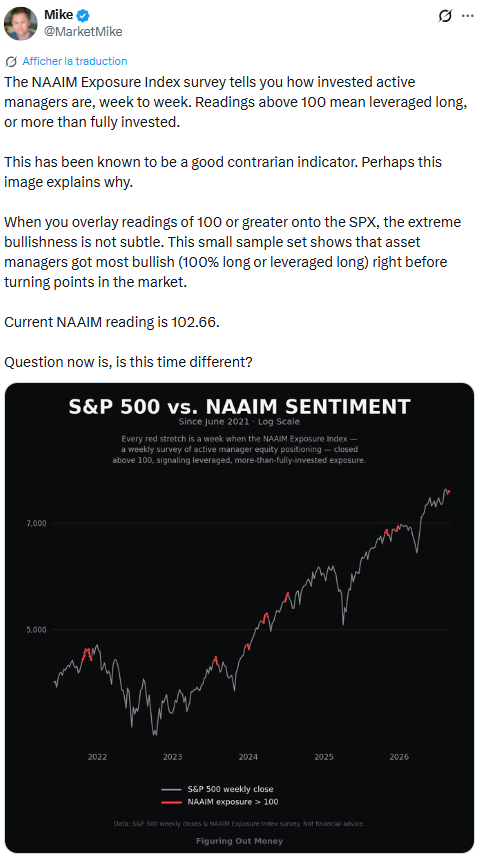
From Figure 1, it appears that values of the NAAIM Exposure Index greater than 100 (in red) are usually followed by retracements in the S&P 500 index, which visually2 confirms that the NAAIM Exposure Index might be a contrarian indicator.
Outside of X, Rob Hanna from QuantifiableEdges has also studied the NAAIM Exposure Index and found that strongly oversold readings could be indicative that the market is so oversold it is ready to rally3.
Nevertheless, the particular conditions described in Hanna3 exclude nearly all4 the occurences of the NAAIM Exposure Index smaller than 20, so that nothing can be concluded about extremely low readings of that indicator from his analysis.
The NAAIM Exposure Index, a continuation indicator?
Contrary to their extremely low counterparts, extremely high readings of the NAAIM Exposure Index greater than 100 are analysed in Hanna3, which concludes that strongly overbought readings are not a contrarian indicator [and] in fact they often suggest strong momentum that is likely to continue3.
As Hanna3 puts it:
As it turns out, when you have a bunch of smart investment managers getting leveraged, there is a good chance that they are right and that there are market gains ahead.
Another perspective is provided by Eric Evans from Trajecta Investment Advisors LLC.
In a LinkedIn post, Evans empirically demonstrates that forward 12-week 10%+ drawdown risk [of the U.S. stock market] falls monotonically as manager exposure rises5.
Figure 2 reproduces Evans’s analysis5, with a couple of months of additional data.
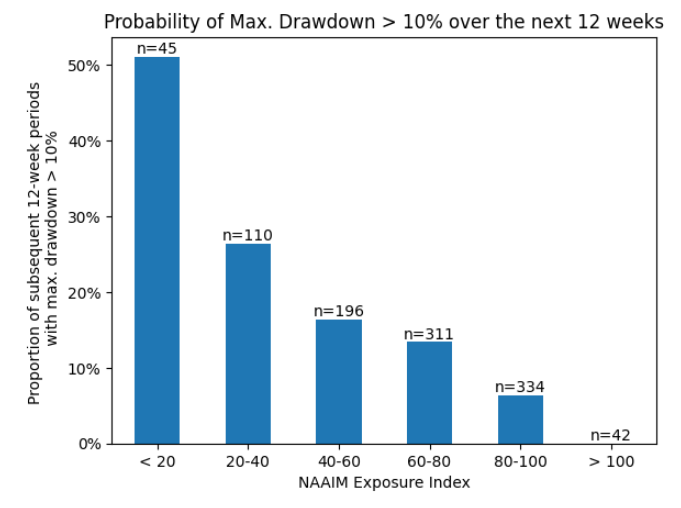
Figure 2 clearly shows that extremely low levels of the NAAIM Exposure Index are associated with a much higher frequency of 10%+ drawdown risk over the subsequent 12 weeks than extremely high levels of that index.
From this perspective, the NAAIM Exposure Index is a continuation indicator, which Evans5 interprets as follows:
Crashes don’t launch from euphoria. They launch from already-nervous positioning that gets more nervous. By the time active managers are fully exposed, the trend driving them in usually has further to run.
Which means a rising NAAIM reading isn’t a warning. It’s a confirmation. More bullish managers ahead means the trend has further to run, not less.
In addition to Hanna’s3 and Evans’5 work, Figure 3 depicts the relationship between the NAAIM Exposure Index and the forward 12-week average U.S. stock market return.
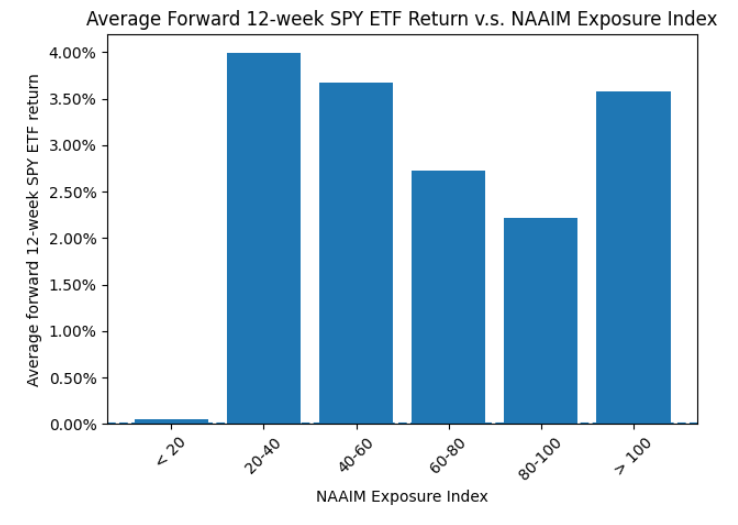
On Figure 3, 3 different patterns are visible:
-
A contrarian behavior in the bulk of the observations
NAAIM Exposure Index levels between 20 and 100 are monotonously decreasing, which suggests a contrarian behaviour.
-
A continuation behavior in the left-tail of the observations
NAAIM Exposure Index levels lower than 20 break the monotonous pattern above and are associated to an average forward 12-week U.S. stock market return of 0%.
-
A continuation behavior in the right-tail of the observations
NAAIM Exposure Index levels greater than 100 break the monotonous pattern above and are associated to an average forward 12-week U.S. stock market return on par with that of 40-60 levels.
All in all, and at least over the medium term, it appears that data strongly support calling the NAAIM Exposure Index a continuation indicator rather than a contrarian indicator!
Examples of usage
As a qualitative indicator
The previous section showed that extremely low levels of the NAAIM Exposure Index have historically been associated with a degraded environment in terms of U.S. stock market returns6 over the subsequent 12 weeks.
Thus, it makes sense to become cautious for one’s portfolio when the NAAIM Exposure Index reaches levels lower than 20.
As a quantitative indicator
More sophisticated investors might want to go beyond a simple7 qualitative usage and integrate the NAAIM Exposure Index directly into their quantitative trading system.
Hepburn’s adaptive rebalancing strategy revisited
From the previous section, one of the simplest idea would be to convert the NAAIM Exposure Index into its historical percentile rank among the observations available at that time and use that percentile rank to dynamically scale the exposure of a portfolio to the U.S. stock market.
For example, at the end of each month, one could:
- Like in the previous blog posts of this series8, compute the 12-week moving average of the NAAIM Exposure Index
- Compute the percentile rank $x$% of that moving average among all the 12-week moving averages of the NAAIM Exposure Index already computed up to that point in time
- Allocate $x$% of the portfolio to the SPY ETF and $1-x$% of the portfolio to cash9
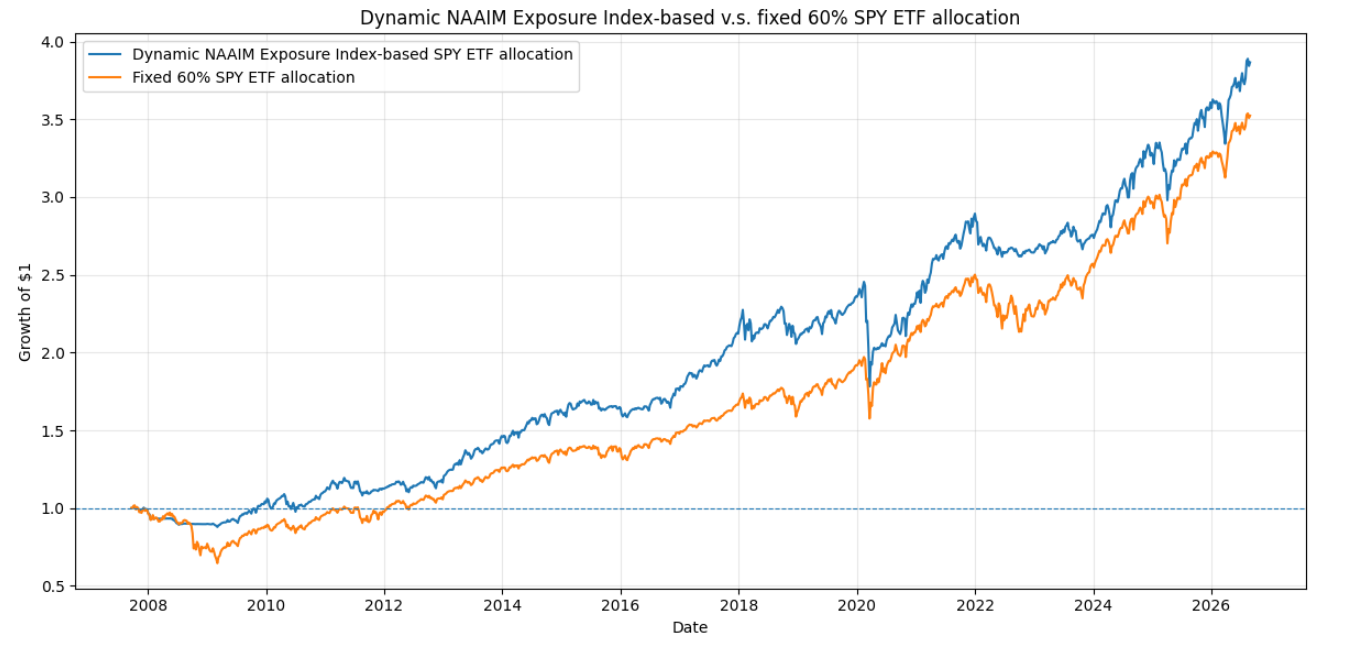
Figure 4 compares such a dynamic NAAIM Exposure Index-based trading strategy to a fixed 60% allocation trading strategy, over the period October 2007 - August 2026.
Associated figures:
| Trading Strategy | Average Stocks Exposure | CAGR | Annualized Sharpe Ratio (0) | Maximum (Weekly) Drawdown |
|---|---|---|---|---|
| Fixed 60% allocation | 60% | 6.88% | 0.66 | 36.52% |
| Dynamic NAAIM Exposure Index-based | 62% | 7.40% | 0.76 | 27.41% |
A couple of remarks on this trading strategy:
- It is a direct extension of the trading strategy proposed by Hepburn10.
- It is built solely on survey results, and does not take into account price, or trend, or volume, or breadth, or anything else3, which really demonstrates the value of the NAAIM Exposure Index3.
- Because it focuses on the offensive sleeve of a 60/40 Portfolio, it might be a good complement to Tom Carlson’s Adaptive 60/40 Portfolio strategy11.
Probability of a 10%+ drawdown of the U.S. stock market in the subsequent 12 weeks
Given the direct relationship between the NAAIM Exposure Index and the forward 12-week drawdown risk of the U.S. stock market exhibited in Figure 2, one additional example of usage of that index could be to build a drawdown forecasting model for the U.S. stock market.
For this, and for the same reasons as in the previous sub-section, I propose to use the 12-week moving average of the NAAIM Exposure Index rather than its (raw) value.
Figure 5 shows that introducing such a smoothing procedure does not degrade the strong relationship between extremely low levels of the NAAIM Exposure Index and the frequency of 10%+ drawdown risk over the subsequent 12 weeks.
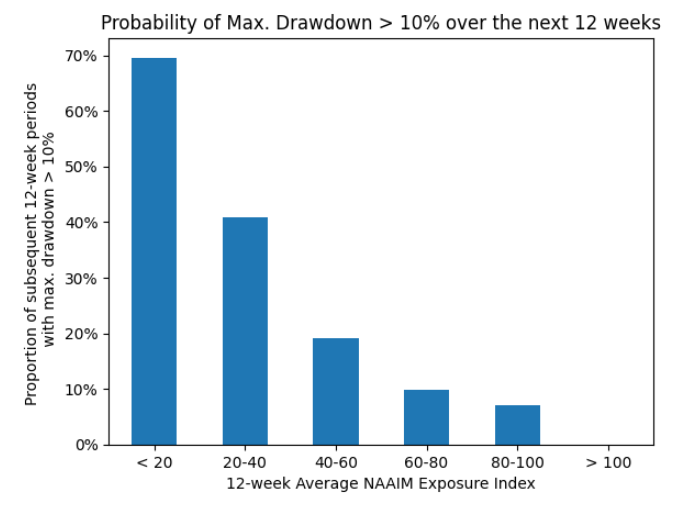
If anything, Figure 5 shows that the left-tail behaviour of that relationship is actually magnified by the usage of a moving average!
Because the relationship exhibited in both Figure 2 and Figure 5 is monotonous, it should in theory be possible to use an isotonic regression to extract explicit probabilities of a forward 12-week 10%+ drawdown of the U.S. stock market from the values of the 12-week moving average of the NAAIM Exposure Index.
Figure 6 depicts these probabilities, extracted from the percentile rank of the 12-week moving average of the NAAIM Exposure Index over the full history (in-sample analysis).
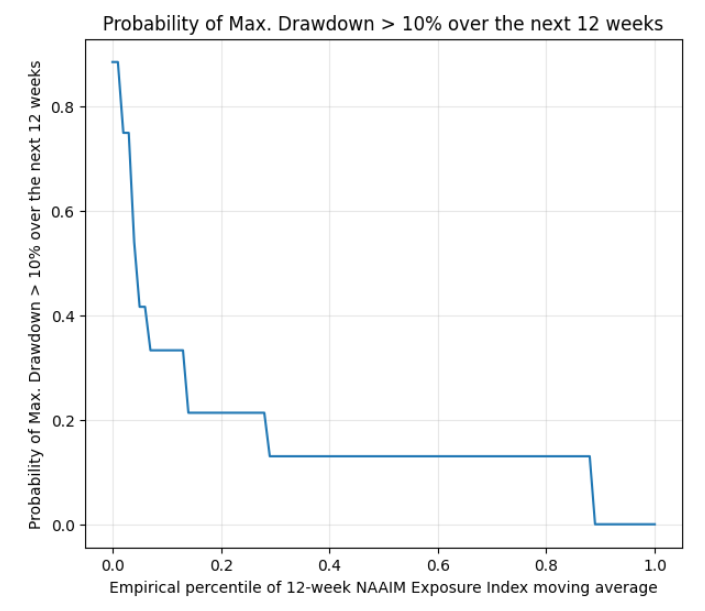
Figure 7 depicts the associated in-sample ROC curve.
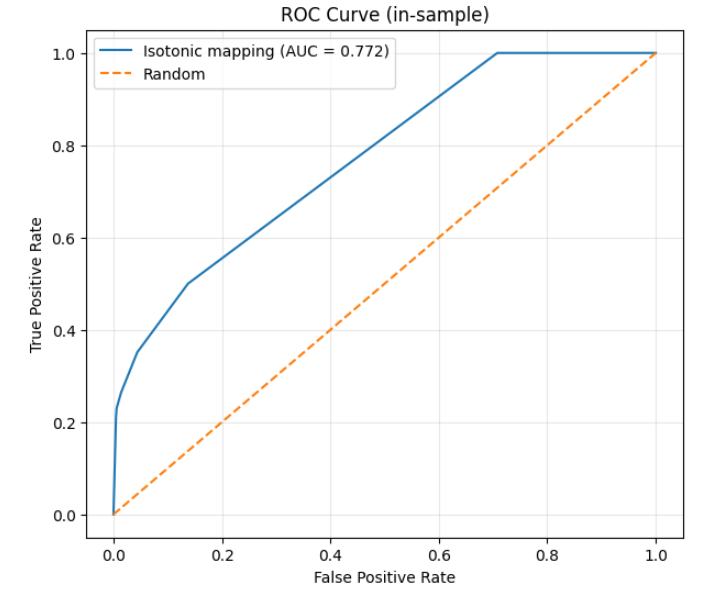
With the associated in-sample detailed forecasting figures and interpretation:
| Metric (in-sample) | Value | Interpretation |
|---|---|---|
| Base Rate | 0.146 | The model baseline |
| ROC-AUC | 0.772 | The model generally ranks events (drawdowns >= 10%+) above non-events (drawdowns < 10%+) |
| PR-AUC | 0.434 | The model is 3x better than the baseline |
| Log Loss | 0.316 | The model predicted probabilities are relatively close to the observed probabilities |
| Brier | 0.096 | The model predictions have relatively low mean squared probability error |
Now moving from in-sample to walk-forward out-of-sample12 forecast evaluation, forecasting performances obviously degrade, as illustrated in Figure 8, but the resulting model is still very much usable.
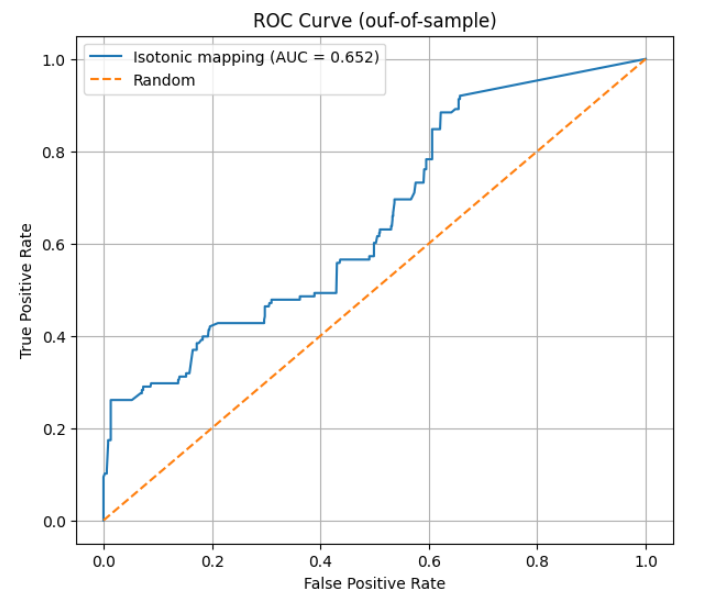
Associated out-of-sample detailed forecasting figures:
| Metric (out-of-sample) | Value |
|---|---|
| Base Rate | 0.144 |
| ROC-AUC | 0.652 |
| PR-AUC | 0.373 |
| Log Loss | 0.736 |
| Brier | 0.109 |
In any cases, as already noted by Hanna3, even if relying solely on [that] index may be overenthusiastic3, utilizing it as one input within a larger model seems completely reasonable and could very possibly strengthen it3.
For obvious reasons, such an exercice is out of scope of this blog post.
As an important side note for the forecasting exercice at hand, the selected 10%+ drawdown threshold has nothing magical.
This is confirmed by Figure 9 and Figure 10.
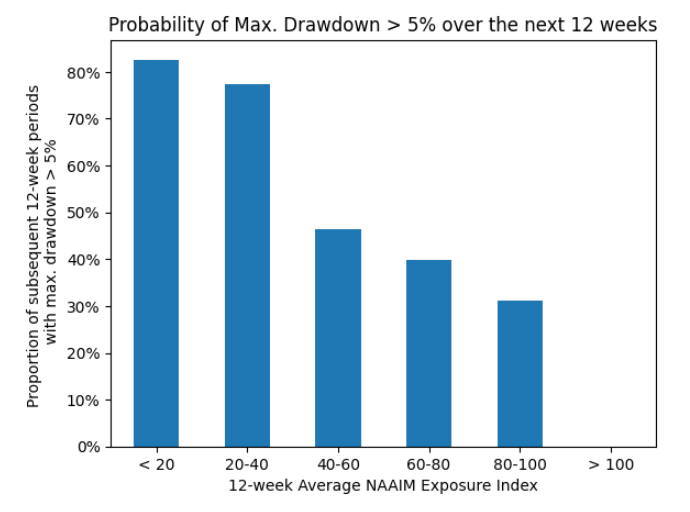
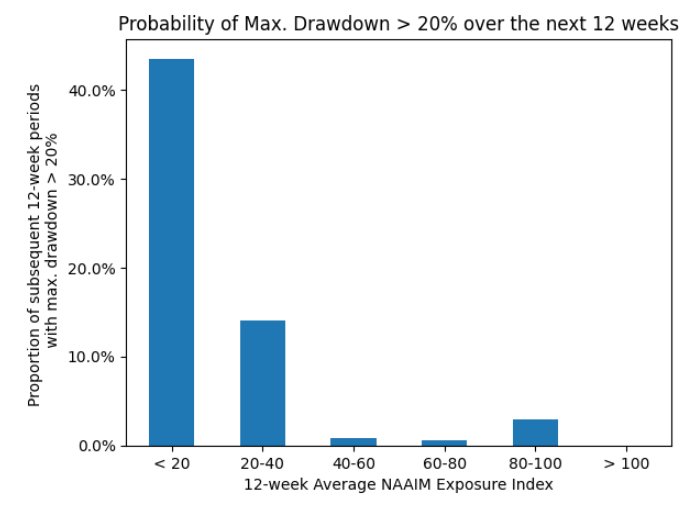
Indeed, on these figures, the 10%+ drawdown threshold of Figure 5 is replaced by a 5%+ (Figure 9) and a 20%+ (Figure 10) threshold and the continuation behaviour in both tails of the observations remains clearly visible.
Conclusion
Sentiment indicators are typically called contrarian indicators because more often than not, the market will move against the sentiment of the majority13.
In the specific case of the NAAIM Exposure Index, though, it seems the common rule inverts the actual signal5, at least within the context studied in this blog post.
As usual, feel free to connect with me on LinkedIn or follow me on Twitter.
–
-
See Proactive Advisor Magazine, Industry insights, Will Hepburn, The backward nature of sentiment indicators. ↩ ↩2 ↩3 ↩4
-
Depending on the time horizon, visuals might be misleading though… ↩
-
See Rob Hanna, Modeling with the NAAIM Exposure Index. ↩ ↩2 ↩3 ↩4 ↩5 ↩6 ↩7 ↩8 ↩9 ↩10 ↩11
-
The first condition listed in Hanna3 filters out 40 of the 45 occurences where the NAAIM Exposure Index is smaller than 20 over the period 05th July 2006 - 16th September 2026. ↩
-
Actually both in terms of raw returns and in terms of the number of major drawdowns. ↩
-
Beware of the midwit meme though; essentially, any quantitative framework built on the NAAIM Exposure Index will ultimately translate very low readings into “bad” and very high reading into “good”. ↩
-
Cash is assumed to have a 0% return. ↩
-
See William T. Hepburn, Hepburn Capital Management, Using Adaptive Rebalancing to Bridge the Gap between Strategic Asset Allocation and Tactical Asset Allocation, October 2009. ↩
-
See Tom Carlson, Adaptive 60/40: Rethinking the Defensive Sleeve, January 20, 2026. ↩
-
Walk-forward out-of-sample forecast with an expanding learning window. ↩
-
See American Association of Individual Investors, Contrarian Indicators, January 2012. ↩