Charles Gave’s Four Quadrants Framework
Since the end of 1970s, it has been noticed that business cycles are marked by the alternation of the phases of recovery, expansion, contraction and recession in aggregate economic activity.
This led to a simple yet powerful macro analysis framework to assess the stages of the economic cycle, called the Growth and Inflation Matrix that is typically represented as a four-quadrant chart1 like illustrated in Figure 1.
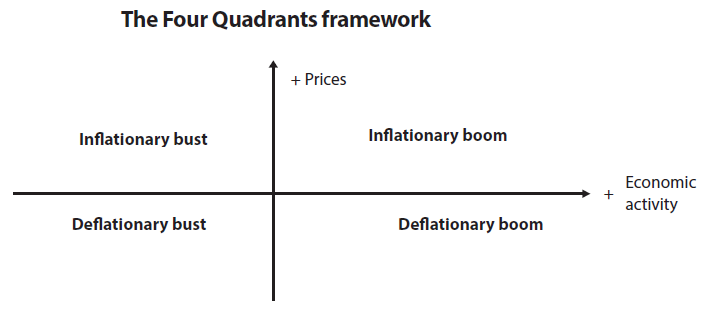
Over the years, that framework has progressively been applied to financial portfolio construction through methodologies like Harry Browne’s Permanent Portfolio or Ray Dalio’s All Weather investment strategy.
While Harry Browne is usually credited for popularizing the four-quadrant framework2, it turns out that in 197813 Charles Gave - a fellow Frenchman - also worked on the same subject4!
On this page5, you will find a live implementation of Charles Gave’s latest contributions to the U.S. Growth and Inflation Matrix, as described in his book The General Theory of Portfolio Construction3.
Live U.S. economic quadrant
Thanks to two economic indicators described in Charles Gave’s book3, it is possible to tentatively “map” in which quadrant U.S. growth and inflation are on a real-time basis.
Live and historical U.S. economic quadrant scoreboard
How is the current economic quadrant determined?
The rationale is explained at length in Charles Gave’s book3:
-
If stock market valuations rise faster than the WTI price, energy is being transformed productively and, thus, economic growth should naturally follow.3
To quantity this relationship, Charles Gave proposes to compare the ratio of the S&P 500 index against the WTI oil price to its 7-year moving average.
Whenever that ratio6 - let’s call it the Energy Efficiency Ratio - is greater than 1, the economy is energy-efficient and must be growing, so that we must be somewhere in the top two quadrants.
-
If long-dated US treasuries [are not] a proper store of value3 against gold, then, inflation must be lurking due to the so-called monetary illusion3.
To quantify this relationship, Charles Gave proposes to compare the ratio of the total return of a 10-year constant-duration Treasury bond3 against the price of an ounce of gold stated in US dollars3 to its 7-year moving average.
Whenever that ratio7 - let’s call it the Currency Debasement Ratio - is greater than 1, the bond market has been a proper store of value, and we must be somewhere in the bottom two quadrants3.
Implementation in Portfolio Optimizer
Portfolio Optimizer computes every day both the Energy Efficiency Ratio and the Currency Debasement Ratio for the U.S. economy, as well as their 1-year and 7-year simple moving averages.
The resulting historical and live datasets are available through the endpoints:
These datasets can be used - like on this webpage - as inputs to determine the current quadrant of the U.S. economy, or as inputs to compute other quantitative metrics.
–
-
See Charles Gave, Four Quadrants: A Wicksellian Analysis, GavekalResearch, Ideas. ↩ ↩2
-
With the launch of the Permanent Portfolio Family of Funds on 1st December 1982, as well as with details about his framework in his 1999 book Fail-Safe Investing. ↩
-
See Charles Gave, The General Theory of Portfolio Construction, GavekalBooks, 2024. ↩ ↩2 ↩3 ↩4 ↩5 ↩6 ↩7 ↩8 ↩9 ↩10
-
The four-quadrant framework is a cornerstone of the financial services company Gavekal that he founded. ↩
-
Powered by the Portfolio Optimizer Web API. ↩
-
On this page, we rather compare the 1-year moving average of the Energy Efficiency Ratio to its 7-year moving average; the added lag is minimal. ↩
-
On this page, we rather compare the 1-year moving average of the Currency Debasement Ratio to its 7-year moving average; the added lag is minimal. ↩