The NAAIM Exposure Index: Incorporating Active Investment Managers Sentiment into Asset Allocation
The NAAIM Exposure Index represents the average exposure to U.S. equity markets as reported by members of the National Association of Active Investment Managers (NAAIM) in a weekly survey.
That index, like any other sentiment indicator, is a useful gauge of the possible future direction of a market1 that can be incorporated into one’s asset allocation process.
In this blog post, I will analyze an example of such incorporation that allows advisors to move to a modified buy-and-hold strategy while dipping their toes into the waters of active management2.
The NAAIM Exposure Index
Definition
The NAAIM Exposure Index is the result of a weekly data collection process organized by the NAAIM since July 20063:
-
Each Wednesday, NAAIM members are asked to report their exposure to the U.S. equity markets at that Wednesday’s close.
The range of possible responses is quite wide, going from -200% (leveraged short) to 0% (cash or market neutral) and to 200% (leveraged long).
-
Each Thursday, responses are collected and processed to compute the average exposure of NAAIM members to the U.S. equity markets, known as the NAAIM Exposure Index.
Here, for example:
- A reading of 93.79 on 29th April 2026 indicates that NAAIM members are on average 93.79% invested in U.S. stocks and 6.21% invested in other assets (cash, bonds…)
- A reading of 106.56 on 26th August 2020 indicates that NAAIM members are on average leveraged long 106.56% in U.S. stocks
- A reading of -3.56 on 5th October 2011 indicates that NAAIM members are on average short 3.56% in U.S. stocks and 96.44% invested in other assets (cash, bonds…)
In addition to the average exposure, the NAAIM also provides other distributional statistics about their members’ U.S. equities exposure (median exposure, standard deviation of exposures…).
These other statistics help contextualizing the raw value of the NAAIM Exposure Index.
For example, compare:
- A reading of 92.43 on 22th November 2006, with a standard deviation of 20.82
- A reading of 92.93 on 31th December 2025, with a standard deviation of 48.97
Both values of the NAAIM Exposure Index are nearly identical, but the later has about twice the uncertainty of the former, highlighting stronger exposure disagreement between NAAIM members.
An interesting remark made by Hepburn4 is that prior to the NAAIM weekly survey of investment managers sentiment, there were no surveys of actual money managers4, most probably explained by the fact that data on what active investment managers do within their portfolios is often a closely guarded secret4.
Limitations
Due to the nature of NAAIM members, the NAAIM Exposure Index presents some limitations that must be kept in mind.
Most are detailled on the NAAIM website, like the fact that reporting a single number for each adviser may not accurately represent the market view of a manager who has short term and long term strategies that are providing conflicting signals5.
Some additional caveats are highlighted by the current6 NAAIM president Ryan Redfern in an interview by StockCharts, like the fact that at Thursday’s open, NAAIM members can wildly change their exposure to U.S. equities compared to their reported position at Wednesday’s close.
Usage as a sentiment indicator
At heart, the NAAIM Exposure Index quantifies how active investment managers are adjusting exposure in real time, managing risk, aligning strategy, and responding to market dynamics7.
As such, the NAAIM Exposure Index is not predictive in nature and is of little value in attempting to determine what the stock market will do in the future5.
Nevertheless, the NAAIM Exposure Index is a sentiment indicator and, like any other sentiment indicator, can be tentatively used for market timing.
For example, Rob Hanna from QuantifiableEdges notes that8:
Extreme highs or lows can signal overbought or oversold conditions and may precede reversals in the market.
For example, if [the NAAIM Exposure Index] falls sharply while markets are relatively stable, it may reflect growing concern among professionals—an early warning signal. Conversely, a surge in exposure may suggest confidence in market upside.
Implementation in Portfolio Optimizer
Portfolio Optimizer allows to easily retrieve the NAAIM Exposure Index, as well as its median and its standard deviation, through the endpoint /markets/indicators/naaim-exposure-index.
Incorporating the NAAIM Exposure Index into asset allocation - Hepburn’s adaptive rebalancing strategy
Hepburn4 proposes to use the NAAIM Exposure Index to bridge the gap between strategic asset allocation [(SAA)] and tactical asset allocation [(TAA)]4 by making periodic adjustments in a [60/40 U.S.] stock and bond allocations to match current market conditions4.
In more details, Hepburn’s adaptive rebalancing4 strategy works as follows:
- At the end of each quarter, compute the 13-week simple moving average of the NAAIM Exposure Index $\overline{NAAIM}_{13w}$
- Allocate $\overline{NAAIM}_{13w}$% of the portfolio to U.S. stocks9 and $\left( 100 - \overline{NAAIM}_{13w} \right)$% of the portfolio to U.S. bonds10
- Hold the portfolio for the following quarter
A little bit less6 than 20 years after its initial publication by William T. Hepburn, how did that strategy fare?
Using the SPY ETF as a proxy for U.S. stocks and the AGG ETF as a proxy for U.S. bonds, Figure 1 compares the evolution of Hepburn’s strategy to a 60/40 portfolio11.
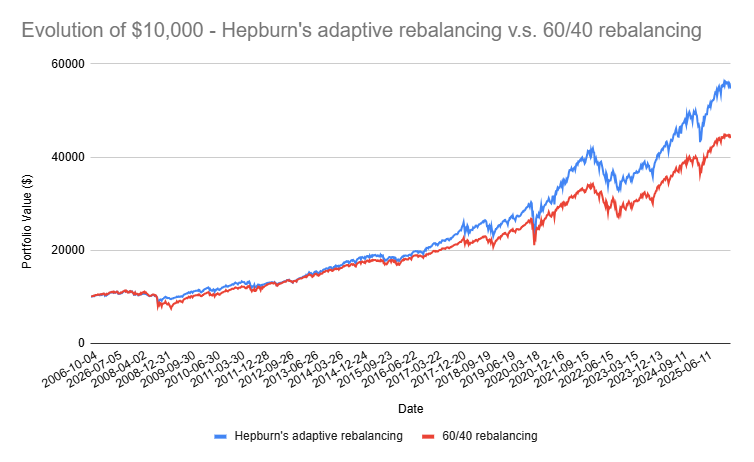
Figures:
| Portfolio Management Strategy | Average Stocks Exposure | CAGR | Annualized Volatility | Annualized Sharpe Ratio | Maximum (Weekly) Drawdown |
|---|---|---|---|---|---|
| 60/40 portfolio | 60% | 7.9% | 11.2% | 0.73 | 34% |
| Hepburn’s adaptive rebalancing | 66% | 9.1% | 11.5% | 0.82 | 25% |
From Figure 1 and associated figures12, it seems Hepburn’s conclusion in 2026 is still valid in 20094, that is:
Tactical Asset Allocation using the NAAIM Survey equity allocations proved itself to be superior to the fixed ratio Strategic Asset Allocation model
As a side note for people familiar with tactical asset allocation and for whom an annualized Sharpe Ratio of ~0.82 might not be particularly attractive, Hepburn4 makes it clear that the proposed adaptive rebalancing strategy is a first (baby) step for investors and advisers wishing to actively adjust their various investment allocations4.
In other words, that strategy is aimed at traditional buy and hold oriented investors and their advisers4.
For those investors, by the way, pairing Hepburn’s adaptive rebalancing strategy together with Meb Faber’s Tactical Yield strategy - recently6 analyzed by Allocate Smartly - might be something to look at.
Less traditional investors are encouraged to add their own twist on that baseline strategy, for example by adding a layer of risk management over the stocks and bonds allocation (moving average, momentum, whatever).
Conclusion
This concludes this short post on the NAAIM Exposure Index.
As usual, feel free to connect with me on LinkedIn or to follow me on Twitter.
–
-
See Proactive Advisor Magazine, Industry insights, Will Hepburn, The backward nature of sentiment indicators. ↩
-
The first reading of the NAAIM Exposure Index dates back to 5th July 2006. ↩
-
See William T. Hepburn, Hepburn Capital Management, Using Adaptive Rebalancing to Bridge the Gap between Strategic Asset Allocation and Tactical Asset Allocation, October 2009. ↩ ↩2 ↩3 ↩4 ↩5 ↩6 ↩7 ↩8 ↩9 ↩10 ↩11
-
See NAAIM Facebook. ↩
-
Represented by the S&P 500 Index. ↩
-
Represented by the Barclay’s Aggregate Bond Index. ↩
-
Quarterly rebalanced. ↩
-
To be noted that Hepburn’s figures4 are based on quarterly data v.s. weekly data for my reproduction, which naturally degrades drawdown and volatility statistics; in addition, beyond the figures displayed, the Ulcer Index of Hepburn’s adaptive rebalancing is about 20% less than that of the 60/40 portfolio! ↩