The NAAIM-AAII Equities Allocation Spread: Another Smart Money Relative Sentiment Indicator
In a previous blog post, I described the NAAIM Exposure Index, which represents the average exposure to U.S. equity markets as reported by members of the National Association of Active Investment Managers (NAAIM) in a weekly survey.
In this second post of this series on sentiment indicators, I will show how that survey of professional money managers can be turned into a relative sentiment indicator thanks to the information provided by the AAII Asset Allocation Survey, which details the exposure to U.S. equity and bond markets as reported by individual investors members of the American Association of Individual Investors (AAII) in a monthly survey.
As an example of usage, I will describe how to use this relative sentiment indicator - that I will call the NAAIM-AAII Equities Allocation Spread for the lack of a better name - to scale the market exposure of a portfolio of U.S. equities, following the original work of Kevin Zatloukal in his Medium article Revisiting the Smart Money.
The NAAIM Exposure Index
The NAAIM Exposure Index is already described elsewhere on this blog.
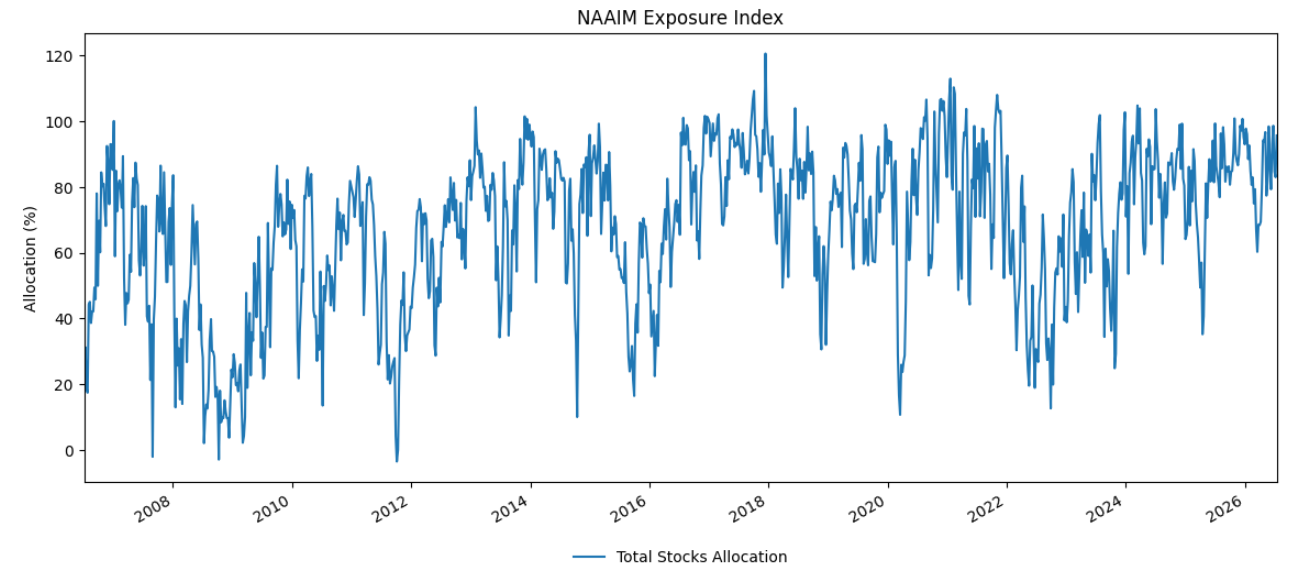
Figure 1 illustrates the evolution of respondents’ average allocation to U.S. stocks since the inception of the NAAIM Exposure Index.
The AAII Asset Allocation Survey
The AAII Asset Allocation Survey is a monthly polling organized by the AAII among its members since 1987, in which participants are asked to communicate their percentage allocations1 to U.S. stocks, bonds, and cash.
For the historical note2, the AAII originally mailed questionnaires at the beginning of each month and tallied the questionnaires received during the month. It later transitioned to online polling in 2000, which allows the results of that survey to be made available at the very beginning of the following month on the AAII website.
As a side note, the AAII also organizes another survey3 - the weekly AAII Investor Sentiment Survey - this time to collect information about the percentage of individual investors who are bullish, bearish, and neutral on the stock market short term4.
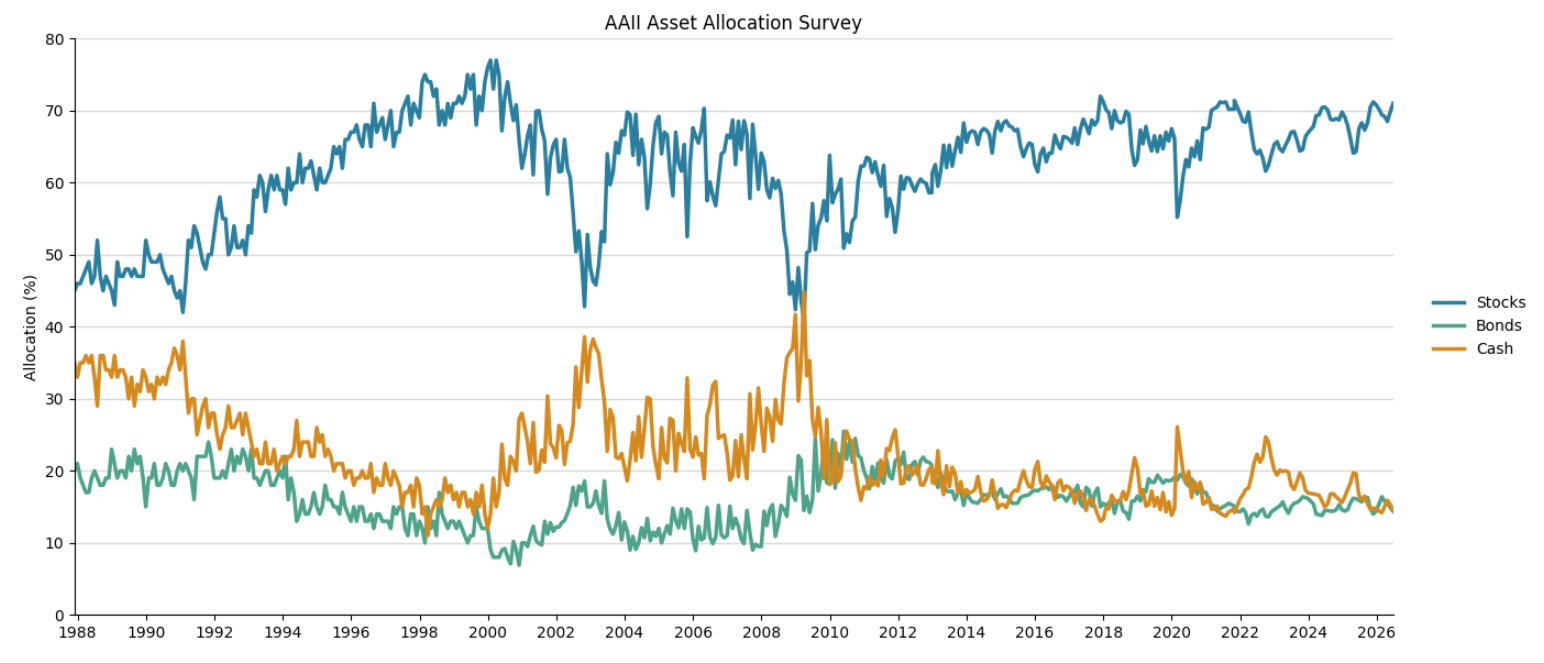
Figure 2 depicts the evolution of respondents’ allocation to U.S. stocks, bonds and cash since the inception of the AAII Asset Allocation Survey.
The NAAIM-AAII Equities Allocation Spread as a relative sentiment indicator
Institutional-versus-individual relative sentiment indicators
Micaletti5 defines institutional-versus-individual relative sentiment (IIRS)6 as a factor that compares the positions, flows, and attitudes of institutional investors to those of retail investors5.
Such relative sentiment indicators comparing smart money6 to dumb money have - at least in theory - potential for exhibiting market timing abilities, because there exists a large and growing body of research […] that shows institutions tend to have better outcomes in the financial markets than retail traders5.
As Micaletti6 puts it:
Although the concept of market timing is often derided, studies have repeatedly shown institutional investors tend to outperform individual investors over intermediate time horizons.
Thus, should one attempt to time the market, mimicking the actions of institutions seems to be a better bet than siding with individuals.
The NAAIM-AAII Equities Allocation Spread
In the context at hand, Zatloukal7 proposes a positions-based IIRS indicator that compares:
- Smart money positionning - The allocation of professional investors8 to U.S. stocks, thanks to the value of the NAAIM Exposure Index
with
- Dumb money positionning - The allocation of individual investors to U.S. stocks, thanks to the value of the total stocks allocation component of the AAII Asset Allocation Survey
Now, in its raw form, there are two immediate problems with that indicator:
-
It is ill-undefined, due to different reporting frequencies between the NAAIM Exposure Index and the AAII Asset Allocation Survey.
To circumvene this issue, one possible solution that introduces no look-ahead bias is to match the last value of the NAAIM Exposure Index of a given month with the total stocks allocation component of the AAII Asset Allocation Survey of said month.
-
Even aligning the reporting dates, there is a huge difference in the volatility of the two reported allocations to U.S. stocks.
As an illustration:
- The NAAIM Exposure Index increased from -2.11 on 29th August 2007 to 39.63 on 5th September 2007, which represents a 41.74% weekly change in U.S. stocks allocation.
- The total stocks allocation component of the AAII Asset Allocation Survey increased from 51.8 on May 2003 to 64.0 on June 2003, which represents a 12.2% monthly change in U.S. stocks allocation.
In order to slow these fluctuations and thereby prevent frequent reversals in the directional positions ultimately prescribed by the [NAAIM-AAII equities allocation spread indicator]6, Zatloukal7 uses a double moving average of the NAAIM Exposure Index, defined as follows:
- A first average at a monthly-ish level, defined by a 5-week moving average of the weekly NAAIM Exposure Index values.
- A second average at a half-year-ish level, defined by a 6-month moving average of the monthly-ish NAAIM Exposure Index values.
On my side, I propose to use9:
- A 26-week moving average of the weekly NAAIM Exposure Index values.
- A 2-month moving average of the monthly total stocks allocation component of the AAII Asset Allocation Survey.
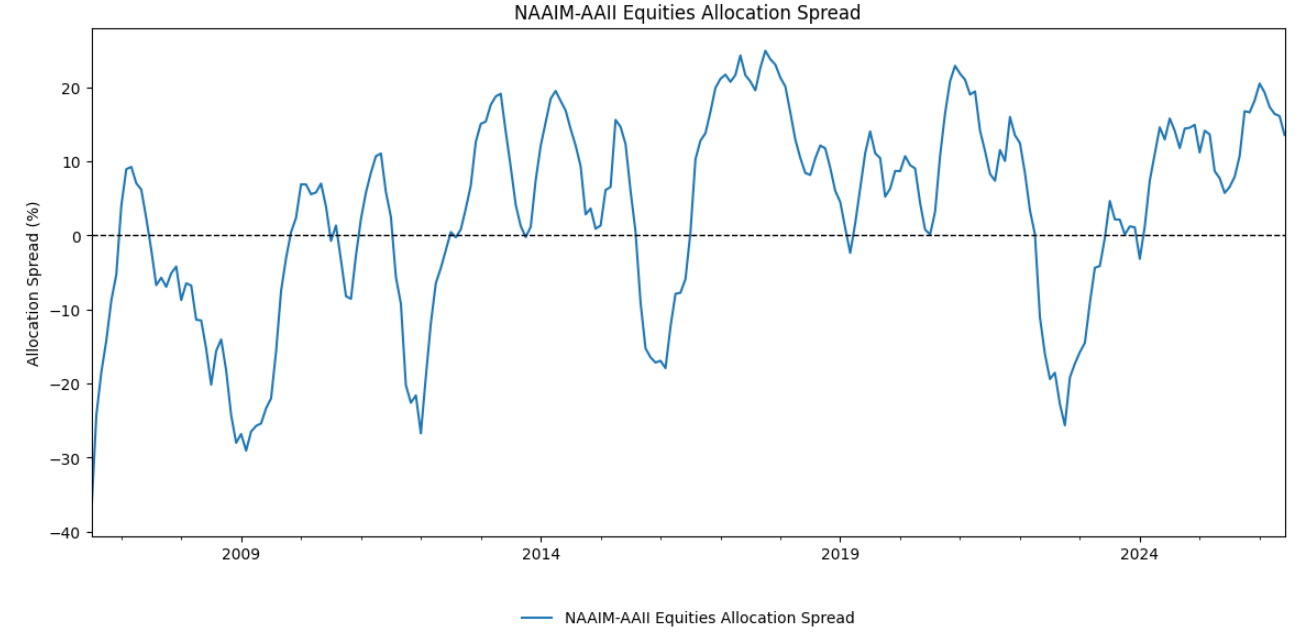
For ease of reference, I will call the resulting relative sentiment indicator the NAAIM-AAII Equities Allocation Spread, whose evolution is depicted in Figure 3.
Readings in Figure 3 should be interpreted as follows:
- When the NAAIM-AAII Equities Allocation Spread is positive (above the dashed horizontal line), active investment managers are relatively bullish U.S. equities v.s. retail intestors.
- When the NAAIM-AAII Equities Allocation Spread is negative (below the dashed horizontal line), active investment managers are relatively bearish U.S. equities v.s. retail intestors.
Comparison with the Smart Money Indicator
The NAAIM-AAII Equities Allocation Spread is similar in spirit to the Smart Money Indicator6, a positions-based IIRS indicator introduced in Micaletti6.
While the construction of the Smart Money Indicator is very different from that of the NAAIM-AAII Equities Allocation Spread, both aim to measure the aggregate positioning in equities of institutions relative to individuals6 and both are designed to be large in magnitude when institutions and individuals have strongly divergent positioning […] and small in magnitude when […] their relative positioning is similar6.
What differentiates the two indicators is that:
-
The Smart Money Indicator relies on the Commitment of Traders (COT) report for its construction.
Unlike the NAAIM Exposure Index or the AAII Asset Allocation Survey, that report is not an informal members survey but an official list of the (futures) positions of all market participants.
-
The Smart Money Indicator relies on multiple pieces of information to estimate the relative positionning of institutions v.s. individuals in U.S. stocks, including information about investors positioning in assets other than the S&P 500 (aka, “cross-hedging pressure”)6.
In contrast, the NAAIM-AAII Equities Allocation Spread is rather fairly naive…
For the interested reader, Ray Micaletti joined Excess Returns in the episode Relative Sentiment Investing with Ray Micaletti to discuss the Smart Money Indicator and more generally all about institutional-versus-individual relative sentiment indicators (domestic equities, international equities, U.S. dollar, bonds, gold…).
Incorporating the NAAIM-AAII Equities Allocation Spread into asset allocation
Zatloukal’s original strategy
More than 25 years ago, Fisher and Statman2 noted that combining the level of sentiment of [different] groups [of investors like individuals, newsletter writers and Wall Street strategists] provides forecasts of future S&P 500 returns that can be used in a tactical asset allocation program2.
It is thus no surprise that it may make sense to adjust allocations to [a portfolio of U.S. equities] based on whether institutions are more or less bullish […] relative to individuals5, and this is exactly what Zatloukal7 proposes: a tactical asset allocation strategy for U.S. equities based on the NAAIM-AAII Equities Allocation Spread.
My interpretation of that strategy is the following:
- At the end of each month
- Compute the current NAAIM-AAII Equities Allocation Spread $S_{NAAIM-AAII}$.
- Compute the average value of the NAAIM-AAII equities allocation spread $\overline{S_{NAAIM-AAII}}$ using all data until the current month.
- Compute the standard deviation of the NAAIM-AAII Equities Allocation Spread $\sigma_{S_{NAAIM-AAII}}$ using all data until the current month.
- If $S_{NAAIM-AAII} \ge \overline{S_{NAAIM-AAII}} - \sigma_{S_{NAAIM-AAII}}$, invest the portfolio in U.S. equities, otherwise leave the portfolio in cash.
Whatever the exact details, Zatloukal7 finds that relative sentiment outperforms the S&P 500 by 0.7% per annum since mid-20077 and that more importantly, it decreases the maximum drawdown to just 21% versus 56% for the S&P 5007.
My own twist
There are two main points that I find can be improved with Zatloukal’s original strategy10:
-
It is a binary stragegy.
In other words, that strategy is either fully invested or fully in cash.
Regular readers of this blog known that I am not a big fan of binary signals and that I usually prefer percentile ranks and similar statistical operators.
-
Its self-normalization mechanism.
I would be more in favor of a self-normalization mechanism like the one used in Micaletti’s Smart Money Indicator, which incorporates z-scores11 and not some -0.25 standard deviation (why not -0.26 or -0.33)?
As a possible alternative, I propose the following tactical asset allocation strategy based on the NAAIM-AAII Equities Allocation Spread:
- At the end of each month12
- Compute the current NAAIM-AAII Equities Allocation Spread $S_{NAAIM-AAII}$
- Compute the percentile rank $r_{S_{NAAIM-AAII}} \in [0, 100]$ of $S_{NAAIM-AAII}$ using all the NAAIM-AAII equities allocation spreads until the current month.
- Invest $r_{S_{NAAIM-AAII}}$% of the portfolio in U.S. equities and $1 - r_{S_{NAAIM-AAII}}$% in cash
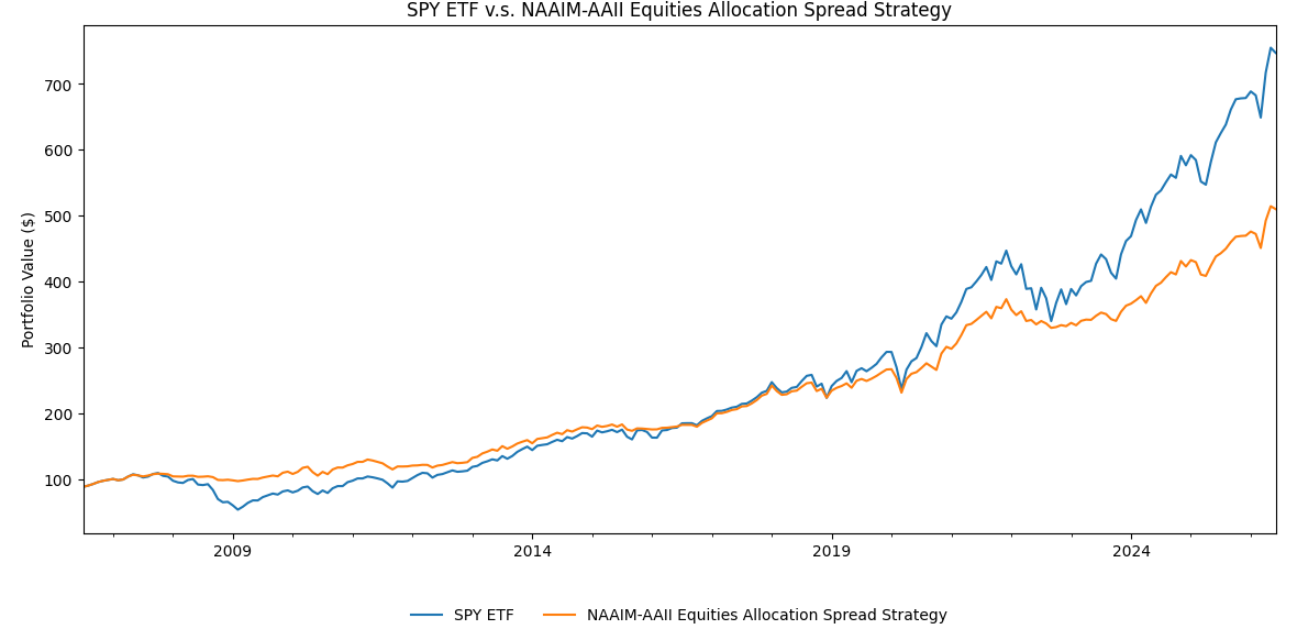
Using the SPY ETF as a proxy for U.S. stocks and the SHY ETF as a proxy for U.S. cash, Figure 4 compares the evolution of that new strategy to a fully invested portfolio.
Figures:
| Portfolio Management Strategy | Average Stocks Exposure | CAGR | Annualized Volatility | Annualized Sharpe Ratio | Maximum (Monthly) Drawdown |
|---|---|---|---|---|---|
| SPY ETF | 100% | 11.31% | 15.31% | 0.78 | 50.80% |
| NAAIM-AAII Equities Allocation Spread-based | 64% | 9.19% | 8.92% | 1.03 | 13.30% |
From these first results, which include more than 3 years of out-of-sample testing compared to Zatloukal7, it would appear that the NAAIM-AAII Equities Allocation Spread is somewhat able to predict the U.S. equity market6.
Naturally, heavy data torturing - similar to what is done in Micaletti6 - would be required before reaching a definitive conclusion, but I will leave it at that for this blog post.
Conclusion
Thanks to the original work of Zatloukal7, we have a brand new positions-based relative sentiment indicator to add in our quantitative arsenal.
Beyond the results of the previous section, Micaletti56 and Zatloukal7 also show that such a relative sentiment indicator might be useful as a complement to a trend following tactical asset allocation strategy.
So, feel free to experiment with that avenue!
To discover more uncommon indicators, connect with me on LinkedIn or follow me on Twitter.
–
-
For stocks and bonds, the survey distinguishes direct holdings v.s. indirect holdings through funds. ↩
-
See Kenneth L. Fisher, and Meir Statman. Investor Sentiment and Stock Returns. Financial Analysts Journal, vol. 56, no. 2, 2000, pp. 16–23. ↩ ↩2 ↩3
-
Whose analysis might be the subject for a future blog post. ↩
-
See AAII Member Surveys. ↩
-
See Micaletti, Raymond, The Complementarity of Trend Following and Relative Sentiment (October 2, 2022). ↩ ↩2 ↩3 ↩4 ↩5
-
See Micaletti, Raymond, Want Smart Beta? Follow the Smart Money: Market and Factor Timing Using Relative Sentiment (April 27, 2018). ↩ ↩2 ↩3 ↩4 ↩5 ↩6 ↩7 ↩8 ↩9 ↩10 ↩11 ↩12
-
See Kevin Zatloukal, Revisiting the Smart Money, Medium article. ↩ ↩2 ↩3 ↩4 ↩5 ↩6 ↩7 ↩8 ↩9
-
At the very least, of active investment managers. ↩
-
To be noted that the specific values used for the smoothing do not seem to really matter, as long as they are sensible. For example, a 13-week moving average of the weekly NAAIM Exposure Index values together with the raw total stocks allocation component of the AAII Asset Allocation Survey lead to similar results. To be consistent with both Zatloukal7 and a NAAIM-based trading strategy described elsewhere, I settled on a 2x13 = 26-week moving average of the weekly NAAIM Exposure Index values, which made me choose a 2x1 monthly moving average of the raw total stocks allocation component of the AAII Asset Allocation Survey. ↩
-
Or, to be more precise, with my interpretation of Zatloukal’s original strategy. ↩
-
Micaletti explains the underlying rationale in Relative Sentiment Investing with Ray Micaletti. ↩
-
To be noted that the result of the AAII Asset Allocation Survey is published on the first day of the month (excluding holidays, etc.) so that this strategy is not implementable in real time; that being said, using the close price of the SPY ETF with a one-day or a two-day lag does not materially impact the results, which is understandable given the nature of the strategy. ↩