Ulcer Performance Index Portfolio Optimization
The Ulcer Performance Index1 (UPI) is a portfolio reward-risk measure introduced by G. Martin2 similar in spirit to the Sharpe Ratio, but using the Ulcer Index (UI) as a risk measure instead of the standard deviation.
In this blog post, I will present the mathematics behind the Ulcer Performance Index portfolio optimization, and compare the results of Portfolio Optimizer with those of the Python open source library Riskfolio-Lib.
Notes:
- A Jupyter notebook corresponding to this post is available on Binder -
- An excellent primer on the Ulcer Index is Looking into the Ulcer Index, from the guys at Newfound Research
Mathematical preliminaries
Similar to the maximal drawdown or to the average drawdown risk measures, the Ulcer Index is a functional of the drawdown curve, so that the associated mathematics in the context of portfolio optimization can be found in Chekhlov et al.34.
Ulcer Index
Let be:
- $n$, the number of assets
- $T$, the number of time periods
- $R_{t,i}$, the arithmetic return of the asset $i$, $i=1..n$ over each time period $t$, $t=1..T$
- $y_t = \left ( y_{t,1}, …, y_{t,n} \right ) \in \mathbb{R}^n$ the vector of the $n$ assets uncompounded cumulative return up to the time period $t$, defined by $y_{t,i} = \sum_{k=1}^{t} R_{k,i}$, $i=1..n$, $t=1..T$
The Ulcer Index $UI(w)$ of the portfolio with assets weights $w = \left ( w_1, …, w_n \right) \in \mathbb{R}^n$ is defined in the context of portfolio optimization5 as
\[\text{UI}(w) =\sqrt{\frac{1}{T}\sum_{k=1}^{T} \left ( \max_{j = 1..k} \left ( \langle w , y_j \rangle \right ) - \langle w , y_k \rangle \right ) ^2}\]Ulcer Performance Index
Additionally, let be:
- $\mu = \left ( \mu_1, …, \mu_n \right ) \in \mathbb{R}^n$, the vector of the arithmetic means of the asset returns over the time periods $1..T$, that is, $\mu_i = \frac{1}{T} \sum_{t=1}^T R_{t,i}$, $i=1..n$
- $r_f \in \mathbb{R}$, the arithmetic mean of the risk-free interest rate over the time periods $1..T$
The Ulcer Performance Index $UPI(w)$ of the portfolio with assets weights $w$ is defined in the context of portfolio optimization5 as
\[\text{UPI}(w) = \frac{\langle w , \mu \rangle - r_f }{UI(w)}\]Ulcer Performance Index maximization
If it exists, the portfolio of maximum Ulcer Performance Index is defined as the portfolio whose assets weights $w^*$ are the solution of the optimization problem
\[w^* = \operatorname*{argmax}_{ w \in S} \frac{\langle w , \mu \rangle - r_f }{UI(w)}\]where $S$ is a compact convex subset of $\mathbb{R}^n$ representing weight constraints like budget constraints, maximum and minimum weight constraints, etc.
Under reasonable assumptions6, it can be demonstrated that this optimization problem has a solution7, computationally tractable34, but not guaranteed to be unique in general8.
Comparison of Riskfolio-Lib and Portfolio Optimizer
I found one open source library, in Python, able to perform Ulcer Performance Index portfolio optimization off the shelf.
This library is called Riskfolio-Lib, and is designed
for making portfolio optimization and quantitative strategic asset allocation.
I will compare the portfolio weights computed by Riskfolio-Lib and by Portfolio Optimizer, as well as their associated computation time.
Notes:
- The internal formulations of Ulcer Performance Index portfolio optimization are different between Riskfolio-Lib and Portfolio Optimizer, but both software use the same mathematics.
Data
I use the monthly closing prices (in €) over the period December 2005 - September 2020 of the following 4 asset classes:
- ICE US Treasury Short Bond
- ICE US Treasury 20+ Year Bond
- Gold
- S&P 500
Notes:
- This dataset was already used in a previous blog post about the integration of Portfolio Optimizer into a website.
- The risk free rate is equal to 0%
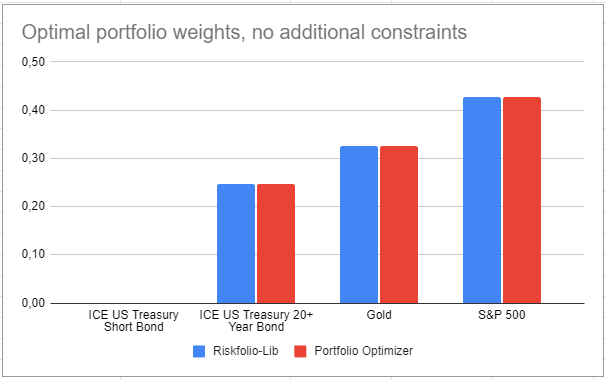
Portfolio optimization with no additional constraints
Let’s first compare Riskfolio-Lib and Portfolio Optimizer when no constraints are imposed apart from the standard full investment/no short sales constraints.
With Riskfolio-Lib, the optimal portfolio is computed thanks to the following methods:
# Build the portfolio object
port = rp.Portfolio(...)

# Estimate input parameters
port.assets_stats(...)

# Compute the optimal portfolio
w = port.optimization(...)
With Portfolio Optimizer, the optimal portfolio is computed by invocking the endpoint /portfolios/optimization/maximum-ulcer-performance-index:
fetch('https://api.portfoliooptimizer.io/v1/portfolios/optimization/maximum-ulcer-performance-index',
      { method: 'POST',
        headers: { 'Content-Type': 'application/json' },
        body: JSON.stringify({ assets: [...], rf: 0 })
      })
It seems both portfolios agree quite well, as illustrated on figure 1!
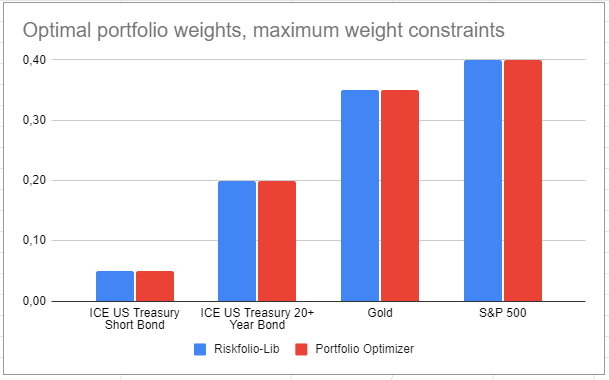
Portfolio optimization with maximum weight constraints
Let’s now compare Riskfolio-Lib and Portfolio Optimizer when maximum weight constraints are imposed.
With Riskfolio-Lib, maximum weight constraints are provided as part of generic linear inequality constraints:
# Build the constraints matrix/vector A*w <= b with
# A == - Identity
# b == - maximum asset weights
A = -np.eye(...)
b = -np.array(...)

# Build the portfolio object
port = rp.Portfolio(..., ainequality=A, binequality=b)

# Estimate input parameters
port.assets_stats(...)

# Compute the optimal portfolio
w = port.optimization(...)
With Portfolio Optimizer, the maximum weight constraints are provided in a dedicated maximumAssetsWeights field:
fetch('https://api.portfoliooptimizer.io/v1/portfolios/optimization/maximum-ulcer-performance-index',
      { method: 'POST',
        headers: { 'Content-Type': 'application/json' },
        body: JSON.stringify({ assets: [...], rf: 0, constraints: { maximumAssetsWeights: [...]} })
      })
Again, it seems both portfolios are nearly identical, as illustrated on figure 2.
(For geeks) Portfolio optimization with the maximum number of assets and asset prices
Let’s finally compare the performances, in terms of total response time, between Riskfolio-Lib and Portfolio Optimizer.
Using a dataset of 20 assets and 500 asset prices, which corresponds to the API limits for the free usage of Portfolio Optimizer:
- Riskfolio-Lib is taking ~450 ms
- Portfolio Optimizer is taking ~1400 ms with standard JSON input data
- Portfolio Optimizer is taking ~1000 ms with gzipped JSON input data
Riskfolio-Lib is hard to beat!
Notes:
- By deploying an instance closer to Binder, it is possible to further reduce the response time of Portfolio Optimizer to ~800 ms, but the the time taken for network transfer and input data decoding still represents a huge proportion of the response time on this small example.
Why Ulcer Performance Index optimization anyway?
As a final remark, why would anyone use Ulcer Performance Index optimization v.s. more standard optimization procedures like Sharpe Ratio optimization?
A paper by Korn et al.9 partially answers to this question.
Korn et al. studied how different risk and reward-risk measures compare to each other in discriminating between portfolio managers10, and concluded that the Ulcer Index $ADD^2$ has a much higher discrimination power than the standard deviation $SD$, c.f. figure 3.
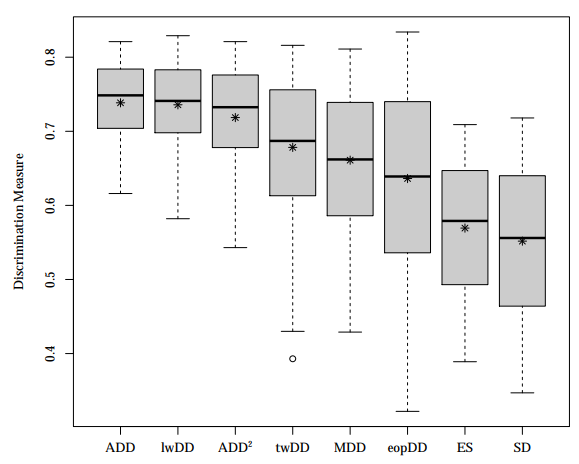
Korn et al. also concluded that there is no difference in discrimination power between the Ulcer Performance Index and the Sharpe Ratio, due to situations when the numerator of the Ulcer Performance Index is negative. Nevertheless, because these situations are avoided in portfolio optimization thanks to one of the reasonable assumptions6, this second conclusion is of no use for the question at hand…
For another perspective, the Ulcer Performance Index seems to be a favorite of some popular quant investing websites:
One of the biggest benefits I think of using UPI as one of the main parameters in choosing your TAA strategy is that it is the indicator most closely correlated to higher safe withdrawal rates in retirement (SWRs). Because SWRs are so dependent on the sequence of returns, more specifically the sequence of negative returns, using a measure that takes that into consideration is important when you are entering or are in the withdrawal phase of your life.
As a side note, there’s a much weaker relationship (and potentially more informational advantage) between Sharpe and another risk-adjusted performance measure that’s a personal favorite of ours, the Ulcer Performance Index (UPI).
So, why not trying it?
–
-
Also known as the Martin Index, the Martion Ratio or the Return-to-Ulcer Ratio. ↩
-
See Martin, P. G. and B. B. McCann (1989). The Investor’s Guide to Fidelity Funds. Wiley. ↩
-
See A. Chekhlov, S. Uryasev, M. Zabarankin, Portfolio Optimization with Drawdown Constraints, Supply Chain and Finance, p 209-228. ↩ ↩2
-
See A. Chekhlov, S. Uryasev, M. Zabarankin, Drawdown Measure in Portfolio Optimization, International Journal of Theoretical and Applied FinanceVol. 08, No. 01, pp. 13-58 (2005). ↩ ↩2
-
This formulation makes the Ulcer Index a convex function of the portfolio weights $w$, which is important for the tractability of the associated optimization problem. ↩ ↩2
-
Assumption 1 - There is no singular points of $UPI(w)$ in $S$, i.e., whatever the asset mix, drawdows cannot be fully avoided and Assumption 2 - It exists $w \in S$ such that $\langle w , \mu \rangle > r_f$, i.e. it exists an asset mix strictly beating the risk free rate in terms of return. ↩ ↩2
-
See W. Dinkelbach, On Nonlinear Fractional Programming, Management Science, Vol. 13, No. 7, Series A, Sciences (Mar., 1967), pp. 492-498. ↩
-
One particular case in which the solution is guaranteed to be unique is when any asset mix beats the risk free rate in terms of return7. ↩
-
See Korn, Olaf; Möller, Philipp M.; Schwehm, Christian (2019) : Drawdown measures: Are they all the same?, CFR Working Paper, No. 19-04, University of Cologne, Centre for Financial Research (CFR), Cologne . ↩
-
Actually, these portfolio managers are “good” and “bad” portfolios generated at random, similarly to the procedure I described in a previous post. ↩