Replicating the J.P. Morgan Efficiente Index
The J.P. Morgan Efficiente 5 Index is a tactical asset allocation strategy designed by J.P. Morgan based on a broad universe of 13 ETFs.
This post will illustrate how to replicate this strategy with Google Sheets.
Notes:
- A fully functional spreadsheet corresponding to this post is available here.
- Credit were credit’s due: I first discovered this strategy on AllocateSmartly.
Strategy rules
The strategy rules are the following1:
-
At the last trading day of each month, the average returns2 and the covariance matrix3 of the ETFs are computed using the last 126 daily closing prices4
-
Then, the computed average returns and covariance matrix are used to compute the mean-variance efficient portfolio with an annualized volatility5 of 5%6
-
Additionally, the computed mean-variance efficient portfolio must obey the following constraints:
-
The assets weights must be an integral multiple of 5%
-
The assets weights must satisfy the following minimum and maximum bounds:
-
| Asset Class | ETF | Ticker | Minimum Asset Weight | Maximum Asset Weight | Maximum Asset Class Weight |
|---|---|---|---|---|---|
| Developed Equities | SPDR S&P 500 ETF | SPY | 0% | 20% | 50% |
| iShares Russell 2000 ETF | IWM | 0% | 10% | ||
| iShares MSCI EAFE ETF | EFA | 0% | 20% | ||
| U.S. Fixed Income | iShares 20+ Year Treasury Bond ETF | TLT | 0% | 20% | 50% |
| iShares iBoxx $ Investment Grade Corporate Bond ETF | LQD | 0% | 20% | ||
| iShares iBoxx $ High Yield Corporate Bond ETF | HYG | 0% | 20% | ||
| Emerging Markets | iShares MSCI Emerging Markets ETF | EEM | 0% | 20% | 25% |
| iShares J.P. Morgan USD Emerging Markets Bond ETF | EMB | 0% | 20% | ||
| Alternative Investments | iShares S&P GSCI Commodity-Indexed Trust | GSG | 0% | 10% | 25% |
| SPDR Gold Shares | GLD | 0% | 10% | ||
| iShares U.S. Real Estate ETF | IYR | 0% | 20% | ||
| Defensive | iShares TIPS Bond ETF | TIP | 0% | 50% | 50% |
| iShares 0-3 Month Treasury Bond7 | SGOV | 0% | 50% |
- Finally, the computed mean-variance efficient portfolio is used to define the J.P. Morgan Efficiente 5 Index for the next trading month
Replication with Google Sheets
Acquisition of the ETFs prices
The ETFs prices can easily be retrieved with the Google Sheet formula =GOOGLEFINANCE().
Too easily, though.
Computation of the ETFs average returns and covariance matrix
The ETFs average returns and covariance matrix can both be computed from the ETFs daily returns with Google Sheets formulas.
Now, the computation of the ETFs covariance matrix is rather cumbersome to implement with Google Sheets formulas alone, so, I will rather use the Portfolio Optimizer endpoint /assets/covariance/matrix/estimation/empirical.
Computation of the mean-variance efficient portfolio
I will use the Portfolio Optimizer endpoint /portfolios/optimization/mean-variance-efficient to compute the desired mean-variance efficient porfolio.
It is straightforward to convert the annualized volatility constraint and the weights constraints into the following Portfolio Optimizer Web API call:
Notes:
- I discarded the constraint that the assets weights must be an integral multiple of 5%, which is anyway inconsequential on the results below.
Validation
ETFs prices from Google Finance
J.P. Morgan people were kind enough to publish a note in March 2021 containing the J.P. Morgan Efficient 5 Index ETFs weights from October 2020 to March 2021:
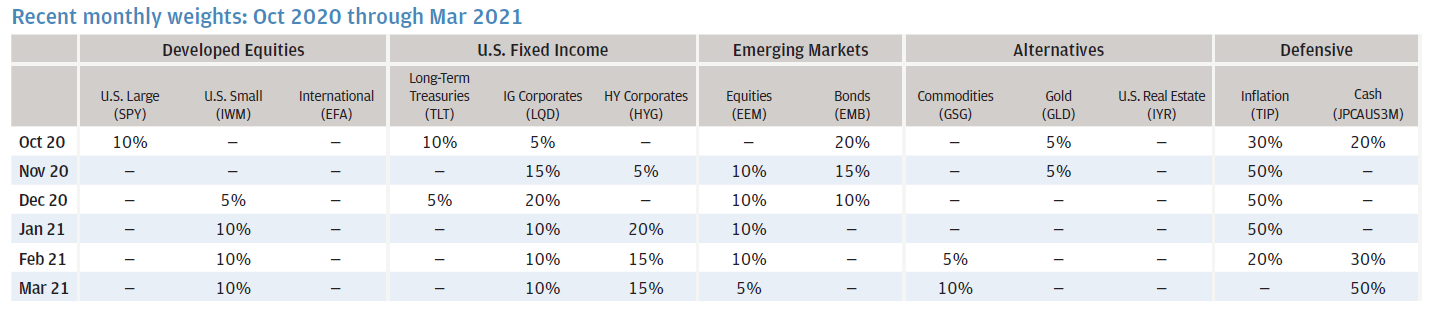
Thanks to this reference, it is possible to compare the replicated strategy ETFs weights v.s. the original strategy ETFs weights as computed by J.P. Morgan people themselves.
For March 2021, here are the replicated stragegy weights, using ETFs prices from Google Finance:

Despite 11 out of the 13 weights nearly perfectly matching8, there is a major issue with the weights for LQD (~18.2% v.s. 10%) and HYG (~5.6% v.s. 10%)!
After some investigation, it appears that the daily closing ETFs prices provided by Google Finance do not contain dividends information, which is obviously an issue for distributing ETFs like LQD and HYG…
ETFs prices from Alpha Vantage
After some more investigation, I decided to use the financial market data provided by Alpha Vantage, which contains daily closing ETFs prices adjusted for dividends.
For March 2021, here are the replicated stragegy weights, now using ETFs prices adjusted for dividends from Alpha Vantage:

All the 13 weights are now perfectly matching8!
Mission accomplished. ![]()
Lesson learned
This post perfectly illustrates that backtesting a trading strategy requires access to both a computing platform and to accurate market data.
For the computing platform, I have just demonstrated that Portfolio Optimizer allows to replicate an institutional-level tactical asset allocation strategy for free, and with a simple spreadsheet ![]() !
!
As for accurate market data, and in particular, for accurate dividend-adjusted daily closing prices:
- Forget Google Finance
- Feel free to experiment with Alpha Vantage (no affiliation)
Geek note
When I first discovered the J.P. Morgan Efficiente Index on AllocateSmartly’s blog, I immediately wanted to find out whether Portfolio Optimizer could compete with the quant team at AllocateSmartly’s:

I am proud to say that Portfolio Optimizer computes the Efficiente Index in less than 50 milliseconds, which nobody would object that can be considered as near real-time.
Mission accomplished again. ![]()
Notes:
- The Portfolio Optimizer computation time could easily be halved with more powerful servers
- The Portfolio Optimizer latency, in particular w.r.t. the US, could easily be improved with geographically distributed servers
If you are interested by any of these possibilities, do not hesitate to reach out!
–
-
Arithmetic average returns. ↩
-
The formula used to compute the covariance matrix is not described, and I suspect this is because no covariance matrix is actually required by the implementation of J.P. Morgan (i.e., brute force computation of the mean-variance efficient portfolio). The formula used to compute the volatility is described, though, and uses logarithmic returns. ↩
-
The 126 closing prices include the closing price of the last day of the month. ↩
-
The formula used to compute the annualized volatility $\sigma_a$ from the daily volatility $\sigma_d$ is $\sigma_a = \sqrt{260} \sigma_d$. ↩
-
In case a mean-variance efficient portfolio with an annualized volatility of 5% does not exist, the solution is described in the J.P. Morgan reference document. ↩
-
I have substituted the non-investable index JPMorgan Cash Index USD 3 Month (JPCAUS3M) by the investable ETF iShares 0-3 Month Treasury Bond. ↩