Integration in Google Sheets
In this post, I will show you how to integrate the Portfolio Optimizer Web API in Google Sheets.
As a working example, I will display the mean-variance minimum variance frontier1 of 4 fictitious assets.
Note: A fully functional spreadsheet corresponding to this post is available here.
Integration in the Google Sheets script editor
This step relies on the Google Sheets JavaScript-like scripting language Google Apps Script.
Integration of the Portfolio Optimizer API
-
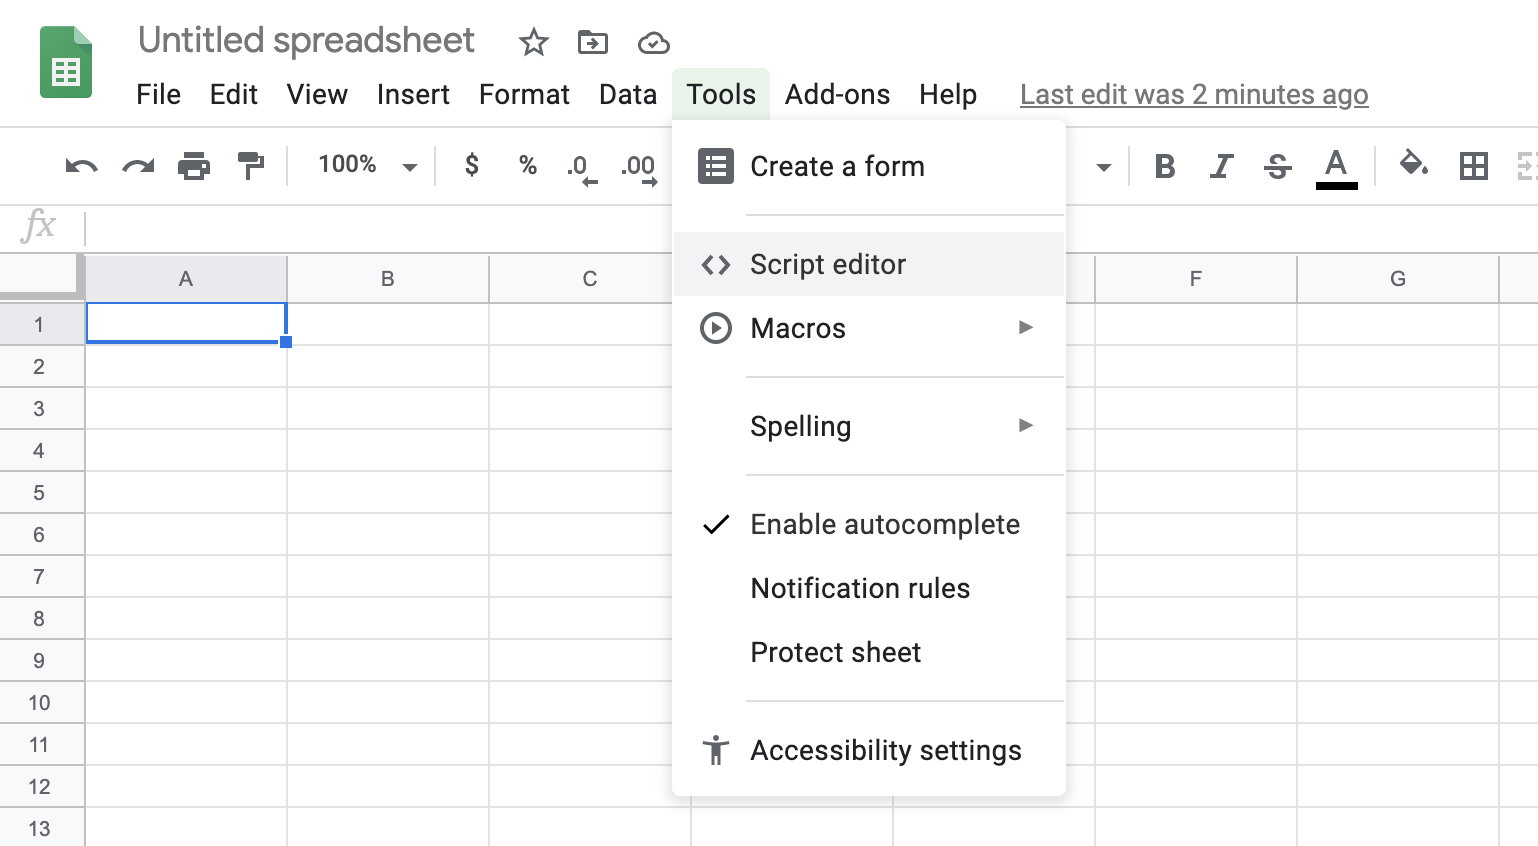
Create a new Google Sheet and select select Tools > Script Editor to launch the script editor:
-
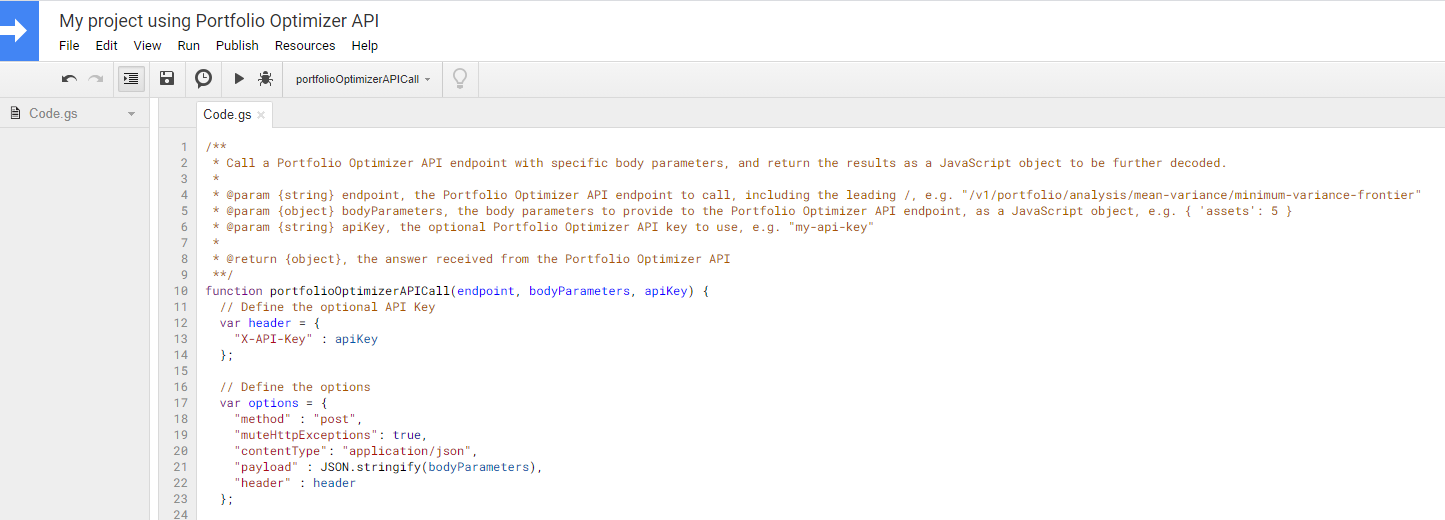
Replace the default script content with the following code:
-
Which gives:
Integration of the Minimum Variance Frontier API endpoint
-
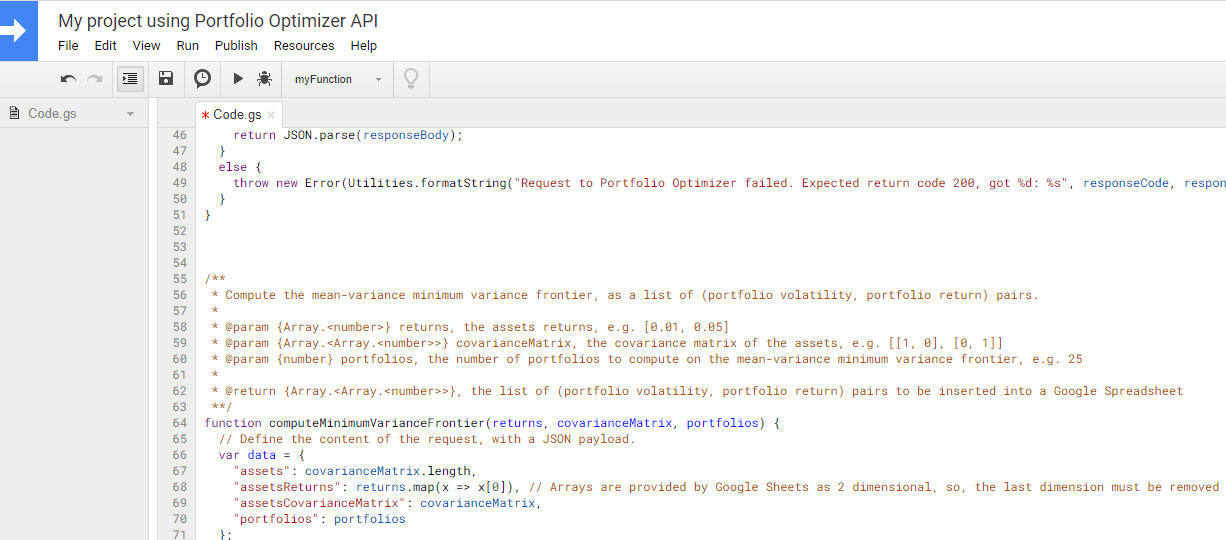
Still in the same script, copy and paste the following code:
-
Which gives:
Integration in the Google Sheets sheet
-
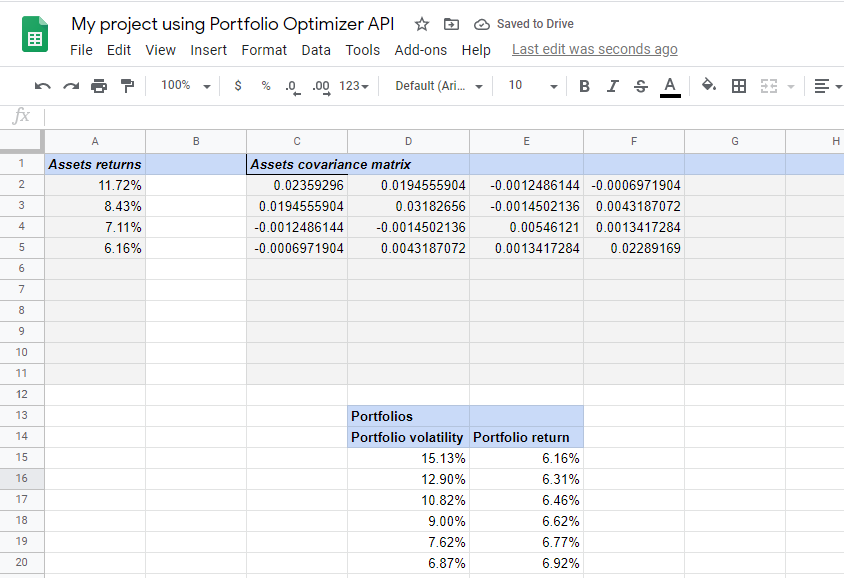
Back to the sheet, define the 4 assets imaginary returns and covariance matrix:

-
Call the
computeMinimumVarianceFrontiermethod defined above, directly from the sheet: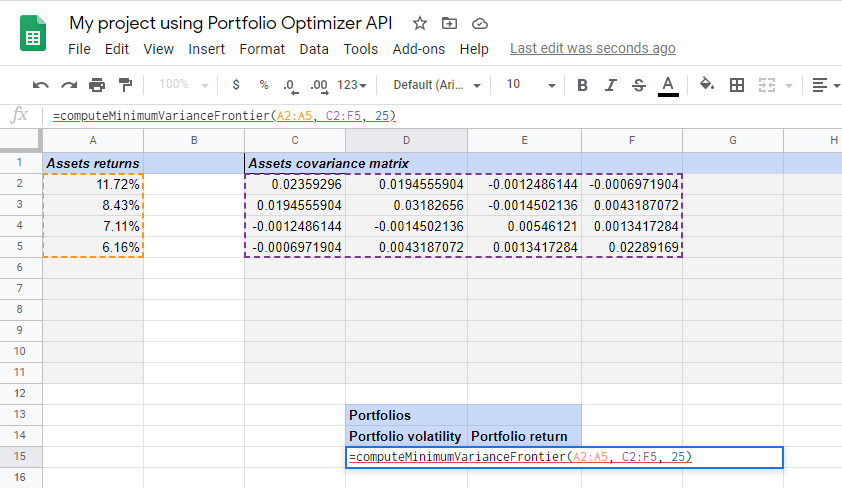
-
Which outputs a list of pairs (portfolio volatility, portfolio return):
-
Which can be displayed in the (V,E) plane to make the mean-variance minimum variance frontier appear:
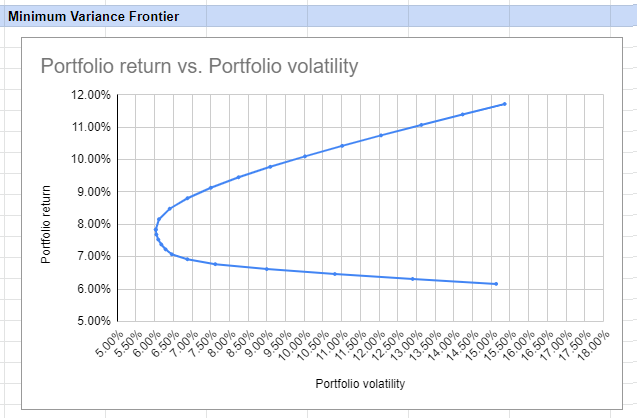
–
-
The mean-variance minimum variance frontier is the set of portfolios in the (V,E) plane with the lowest volatility for any given return. ↩